How to Build a Google Ads Dashboard in Claude

By Robin Laseur
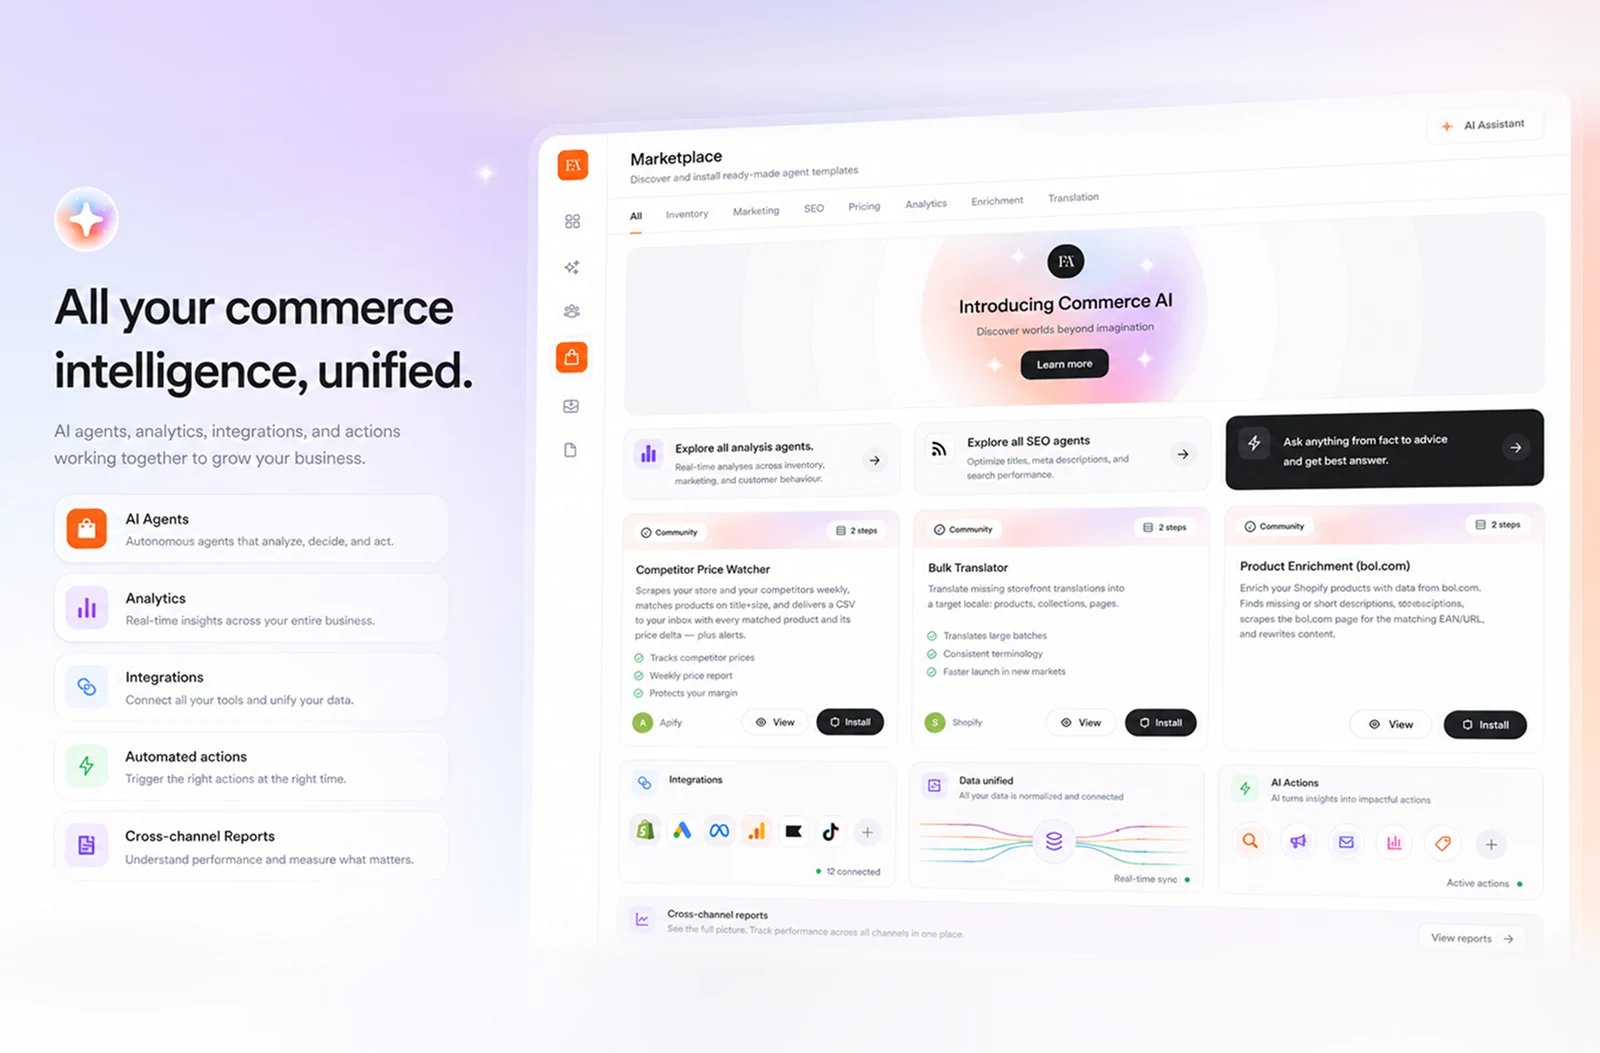
Weekly Google Ads reporting becomes slower when each new question needs another campaign breakdown, date comparison, or export. Before interpreting performance, the team has to retrieve and organise the figures again.
To build that reporting view in Claude, connect Google Ads to Commerce365, then connect Commerce365 to Claude through its MCP server. Claude uses the available Commerce365 tools to retrieve account data and assemble the dashboard you request.
This guide explains that connection, checks that Claude can reach the intended account, and then builds a dashboard with defined metrics, campaign comparisons, and validation against Google Ads.
What is a Google Ads dashboard in Claude?
A Google Ads dashboard in Claude is an analysis view generated from connected account data. You specify the account, reporting period, metrics, breakdowns, and output format. Claude then uses the available connector tools to retrieve the data and organise it as tables, comparisons, or a written summary.
Because the view is conversational, you can continue from the initial result. If account-level CPA increased, you can ask which campaigns contributed most. If one campaign stands out, you can request a device, location, ad-group, or search-term breakdown when those fields are available.
The word dashboard needs a clear boundary here. A result generated in a Claude conversation is an on-demand reporting view. It is not automatically a continuously refreshing BI dashboard. Reusing a prompt, saving a report, scheduling a run, and distributing an updated file are separate capabilities. Each requires a defined refresh path.
The first task is to establish the connection. If Commerce365 is already connected to Google Ads and enabled in Claude, go directly to the connection check below before building the reporting view.
Connect Google Ads to Claude through Commerce365
There are two connections to complete: Google Ads to Commerce365, and Commerce365 to Claude. Installing the Shopify app alone does not complete both.
What Commerce365 does in this workflow
Commerce365 supplies the connection between the advertising account and Claude. Its published connection guide describes an MCP server that exposes tools for retrieving data from connected platforms. MCP, or Model Context Protocol, gives Claude a way to request that data through those tools.
Component | Role in the dashboard |
|---|---|
Google Ads | Source of campaign and performance data |
Commerce365 | Authorises access to Google Ads and exposes retrieval tools through MCP |
Claude | Calls the available tools, organises their results, and calculates or explains the requested reporting view |
In practical terms, your prompt starts a retrieval request through Commerce365. The returned data supplies the figures Claude presents. A request that produces no tool call has not demonstrated account access.
Before you connect
Have access to the Shopify store where you will install Commerce365, a Google identity with access to the intended Google Ads account, and a Claude account that can use custom connectors. Keep the Google Ads customer ID available so you can check which account is being queried.
For a managed Claude workspace, confirm that your organisation permits the connector. Anthropic documents the organisation setup requirements in its custom connector guide.
Step 1: Install Commerce365 in Shopify
Install Commerce365 from its Shopify App Store listing and complete the app authorisation. Open the app to continue setup. Its listing identifies Google Ads as a supported integration.
Checkpoint: you can open Commerce365 for the intended Shopify store. Google Ads access still needs to be authorised separately.
Step 2: Connect your Google Ads account to Commerce365
Following Commerce365's connection guide, open Integrations, choose Connect for Google Ads, and sign in with the Google identity that has access to the advertising account. Review the OAuth permissions and select the intended account where prompted.
Checkpoint: Google Ads appears connected in Commerce365. Check the account selection against your customer ID.
Commerce365's privacy policy describes its Google Ads connection as used read-only in practice. Review the actual permission screen during authorisation; the dashboard prompts in this guide only request reporting data.
Step 3: Connect Commerce365 to Claude
Use the MCP server URL supplied in your Commerce365 dashboard. In Claude's Customize > Connectors, add a custom web connector, name it Commerce365, enter that URL, and complete the authentication flow. Follow Commerce365's supplied settings if additional configuration is required.
Anthropic's current connector instructions describe this setup. Labels may vary by interface. Do not substitute the Commerce365 homepage URL for the MCP endpoint.
Checkpoint: Commerce365 is connected in Claude. For a managed workspace, an authorised administrator may need to add it before you can connect individually.
Step 4: Enable Commerce365 and check data access
Open a Claude conversation and enable Commerce365 through the chat's + > Connectors menu. Before requesting a dashboard, try a small query:
Prompt:
Use the connected Commerce365 tools to retrieve Google Ads campaign cost for customer ID [CUSTOMER ID] from [START DATE] through [END DATE]. Return campaign IDs, names, and cost with the account currency where available. Identify the tool used and any unavailable fields. Use retrieved data only; do not generate example figures or make account changes.
Replace the placeholders, inspect the tool result, and compare a campaign's cost with Google Ads for the same dates. If the connector cannot reach the customer, resolve access before continuing. A generic answer or an example table is not a successful connection check.
Checkpoint: the tool returns data for the intended customer and reporting period. The next sections define the full dashboard and validate its calculations.
For the broader setup, including Meta Ads, see the Google Ads and Meta Ads connection guide.
Start with the question the dashboard needs to answer
A useful dashboard starts with a reporting job, not a long list of available metrics. The reporting job determines which data belongs in the view and how much detail the reader needs.
Weekly performance monitoring
A weekly performance dashboard usually needs to answer:
How much did the account spend?
How many primary conversions were recorded?
What conversion value did Google Ads attribute to the campaigns?
How did CPA and ROAS change from the previous period?
Which campaigns contributed most to those changes?
This article uses weekly performance monitoring as its main example. It creates a practical base that can later support deeper analysis.
Budget pacing
A pacing dashboard compares spend with a defined budget and the time elapsed in the reporting period. It requires current budget data, a pacing rule, and a clear treatment for shared or changed campaign budgets. Only add pacing when the connected tools expose the required budget fields.
Campaign investigation
An investigation dashboard starts with a known movement: rising CPA, falling conversion value, or a sudden change in spend. It needs more diagnostic detail than a recurring overview. The investigation may move from account to campaign, then to ad group, search term, device, location, or another relevant breakdown.
Match the output to its reader
The same account can support different views:
Reader | Useful dashboard output |
|---|---|
Performance marketer | Campaign metrics, calculations, comparisons, and diagnostic breakdowns |
Ecommerce manager | Spend, conversions, attributed value, trends, and exceptions |
Founder or director | Short summary, largest movements, and the figures supporting them |
Define the audience before writing the prompt. It determines whether Claude should return a detailed working table or a short management summary.
Confirm the account and reporting scope
Before choosing KPI cards or charts, define the boundaries of the report. A polished dashboard built from the wrong account or period is still wrong.
Confirm the Google Ads customer
Ask Claude to retrieve the customer name, customer ID, account currency, and timezone through the connected Commerce365 tools. Google Ads account hierarchy data can include these fields, which makes them useful identity checks.
Use a prompt such as:
Prompt:
Using the connected Commerce365 tools, identify the Google Ads customer available to this conversation. Return the customer name, customer ID, currency, and account timezone. State which tool supplied the result and identify any unavailable field. Do not infer missing values.
Compare the returned customer ID with the account you intend to report on. This is especially important when one login can reach several client accounts through a manager account.
Use exact reporting dates
Google Ads reporting supports custom and predefined date ranges, but the final dashboard should display the exact start and end dates used. Relative labels such as “last week” can be interpreted differently depending on the day the prompt is run.
For a recurring report, define the logic and require Claude to translate it into dates. For example:
last seven complete days;
the seven complete days immediately before that period;
month to date through yesterday; or
the previous month through the equivalent calendar day.
Use the Google Ads account timezone as the reporting reference.
Choose the reporting grain
The first version of the dashboard should use:
account-level totals for the headline metrics;
campaign-level data for the performance table; and
daily or weekly segments for the trend view.
Reserve ad groups, ads, keywords, search terms, devices, locations, and other diagnostic dimensions for follow-up questions. Loading every available breakdown into the main dashboard makes changes harder to interpret.
Choose the Google Ads metrics before building the dashboard
The dashboard prompt should name the metrics and state what they mean. This prevents Claude from silently substituting a nearby field.
Delivery and traffic metrics
Start with the fields that describe how the ads were delivered:
Impressions: how often the ads were shown.
Clicks: recorded ad clicks.
CTR: clicks divided by impressions.
Cost: advertising spend for the selected period and account currency.
These metrics help explain whether a performance change began with reach, traffic volume, or traffic cost.
Conversion metrics
Google Ads distinguishes between “Conversions” and “All conversions”. According to Google Ads Help, the “Conversions” column reports conversions across primary conversion actions. Secondary actions can appear in “All conversions”, which provides a broader view.
For the base dashboard, select one conversion field explicitly. This guide uses:
Conversions: primary conversion actions included in the main reporting column.
Conversion value: the value associated with those conversions.
Cost per conversion: cost divided by conversions.
Conversion value per cost: conversion value divided by cost, commonly presented as ROAS.
Do not mix “Conversions” with “All conversion value”, or “All conversions” with the primary “Conversion value”, unless the reporting purpose calls for that combination and the definitions are explained.
Dashboard calculations
Ask Claude to retain the source values behind every calculated KPI.
CTR = Clicks ÷ Impressions × 100
CPA = Cost ÷ Conversions
ROAS = Conversion value ÷ Cost
If conversions or cost equal zero, Claude should leave an affected ratio blank or label it as not applicable rather than forcing a value.
Conversion lag
Recent conversion totals may still change. Google documents conversion lag as the delay between an ad interaction and the conversion being reported. Google also notes that conversion reporting can be delayed, particularly for attribution models beyond last click.
This matters when the dashboard compares a recently completed period with an older one. The newest period may appear weaker before all conversions have arrived. Require the dashboard to mark a recent period as preliminary when conversion lag may materially affect the interpretation.
Dashboard metric specification
The first version can follow this structure:
Dashboard element | Metrics | Grain | Comparison |
|---|---|---|---|
Headline KPIs | Cost, conversions, CPA, conversion value, ROAS | Account | Previous equivalent period |
Campaign table | Impressions, clicks, CTR, cost, conversions, CPA, conversion value, ROAS | Campaign | Current and previous period |
Trend view | Cost, conversions, conversion value | Day or week | Time series |
How to build the first Google Ads dashboard in Claude
Build the dashboard in stages. Each stage creates a result you can check before adding another layer.
Step 1: Inspect the available Google Ads fields
Ask Claude to inspect the connector before requesting the full dashboard:
Prompt:
Using the Commerce365 Google Ads tools, list the account fields, campaign dimensions, metrics, and date segments available for reporting. Specifically check for customer ID, currency, timezone, campaign ID, campaign name, campaign status, advertising channel type, impressions, clicks, cost, conversions, conversion value, cost per conversion, conversion value per cost, and date. Group the result by field type and state which requested fields are unavailable.
Expected result: a field inventory that shows what the connected tools can actually return.
If a required field is unavailable, adjust the dashboard specification before continuing. Do not ask Claude to reconstruct account data from assumptions.
Step 2: Build the account overview
Start with account-level values:
Prompt:
Using Commerce365, build a Google Ads account overview for customer ID [CUSTOMER ID] from [START DATE] through [END DATE], using the account timezone. Compare it with [COMPARISON START DATE] through [COMPARISON END DATE]. Show the exact dates, account name, customer ID, currency, cost, conversions, cost per conversion, conversion value, and conversion value per cost. Use the primary Conversions and Conversion value fields. Show the current value, previous value, absolute change, and percentage change. Include the source fields used in each calculation. Do not recommend actions.
Expected result: an account-level table with a visible account scope, dates, currency, selected conversion field, and comparison period.
Step 3: Add the campaign performance table
Once the account totals are correct, add campaign detail:
Prompt:
Add a campaign table for the same current and comparison periods. Include campaign ID, campaign name, campaign status, advertising channel type, impressions, clicks, CTR, cost, conversions, CPA, conversion value, and ROAS. Show current and previous values for cost, conversions, CPA, conversion value, and ROAS, followed by the absolute and percentage change. Sort by current-period cost and keep the source values behind every calculated metric.
Expected result: a campaign table whose current-period cost, conversions, and conversion value can be summed and compared with the account overview, subject to matching filters and available campaign rows.
Step 4: Add the trend view
Use daily data for shorter reports and weekly data for longer ranges:
Prompt:
Add a daily trend table for cost, conversions, and conversion value during the current period. Identify the dates with the largest movements, but describe only changes visible in the returned data. If chart rendering is available, create a separate chart for cost and for conversions. Keep the underlying table visible.
Expected result: a time-series table that makes the timing of the movement visible. A chart can supplement the table but should not replace the source values.
Step 5: Add a written summary
After checking the tables, ask for a reader-specific summary:
Prompt:
Summarise the verified dashboard for an ecommerce manager. Report the largest measured improvement, the largest measured decline, and the campaigns that contributed most to each movement. Put the supporting figures directly below every observation. Separate facts from items that require further investigation. Do not recommend a budget change.
Expected result: a concise summary whose claims can be traced to the dashboard tables.
Master prompt for a reusable Google Ads dashboard
After validating the staged build, combine the requirements into one reusable prompt:
Prompt:
Use the connected Commerce365 Google Ads tools to build a dashboard for customer ID [CUSTOMER ID].
Reporting scope
Current period: [START DATE] through [END DATE]
Comparison period: [COMPARISON START DATE] through [COMPARISON END DATE]
Use the Google Ads account timezone and currency
Use the primary Conversions and Conversion value fields
Output
Show the account name, customer ID, currency, timezone, exact reporting dates, and data retrieval time.
Create an account KPI table with cost, conversions, CPA, conversion value, and ROAS. Show current value, previous value, absolute change, and percentage change.
Create a campaign table with campaign ID, name, status, advertising channel type, impressions, clicks, CTR, cost, conversions, CPA, conversion value, and ROAS. Include the comparison values and changes for cost, conversions, CPA, conversion value, and ROAS. Sort by current-period cost.
Create a daily trend table for cost, conversions, and conversion value.
Identify the campaigns that contributed most to account-level changes. Support every observation with returned figures.
List missing fields, connector limitations, possible conversion-lag effects, and any result that could not be calculated.
Calculate CTR as clicks divided by impressions, CPA as cost divided by conversions, and ROAS as conversion value divided by cost. Show the source values used. Do not estimate unavailable data and do not recommend campaign or budget changes.
Replace the placeholders before running the prompt. If this is a recurring report, keep the dashboard specification stable and change only the account or reporting dates.
How to verify the Claude dashboard against Google Ads
The dashboard is ready for interpretation only after its core values reconcile with Google Ads.
Check the reporting scope
Confirm these fields first:
customer ID;
account name;
currency;
timezone;
current-period dates;
comparison-period dates; and
selected conversion field.
A mismatch in any of these fields can affect every number below it.
Reconcile the account totals
Open Google Ads and configure the same date range and columns. Compare:
cost;
impressions;
clicks;
conversions; and
conversion value.
Use the primary “Conversions” and “Conversion value” columns if that is what the Claude dashboard requested. If the totals differ, check filters and field definitions before checking Claude's calculations.

Use the matching Google Ads account, dates, columns, and campaign scope when reconciling Claude’s dashboard. Source: Google Ads Help.
Reconcile selected campaigns
Choose at least three rows:
the campaign with the highest spend;
the campaign with the most conversions; and
a campaign showing a large period change.
Compare campaign ID, cost, clicks, conversions, and conversion value with Google Ads. Campaign IDs are safer identifiers than names because names can be similar or changed.
Recalculate CPA and ROAS
Use the displayed source values to verify:
CPA = Cost ÷ Conversions
ROAS = Conversion value ÷ Cost
Check how the dashboard handles zero conversions, zero cost, and rounding. Also confirm that it did not combine a primary conversion count with an all-conversion value.
Check for conversion lag
If the report includes recent dates, review conversion lag in Google Ads. Mark recent results as preliminary when the account typically records conversions several days after the original interaction.
Add a validation footer
Keep the following context with every dashboard:
Google Ads customer ID;
reporting dates;
account timezone;
currency;
conversion field;
retrieval time;
reconciliation date; and
known data limitations.
This footer makes later comparisons easier and prevents a stakeholder from reading the figures outside their reporting context.
Refine the dashboard with follow-up prompts
Once the base view reconciles, use follow-up prompts to investigate a measured change.
Find the campaigns driving an account-level movement
Prompt:
Account CPA increased between the two dashboard periods. Decompose the change by campaign. Show how cost, clicks, conversions, conversion value, CPA, and ROAS changed for each material contributor. Rank the campaigns by their contribution to the account-level CPA movement and show the figures used.
This prompt asks for decomposition rather than a generic explanation.
Compare campaign types
Prompt:
Group the current and comparison-period campaign results by advertising channel type returned by Google Ads. Show cost, conversions, CPA, conversion value, and ROAS for each type. Do not create categories that are absent from the source data.
The returned account may include Search, Shopping, Performance Max, Display, Demand Gen, Video, or another supported type. Let the source data determine the groups.
Investigate traffic efficiency
Prompt:
For the campaigns with the largest cost increase, compare impressions, clicks, CTR, average CPC, conversions, and conversion rate between periods. Identify whether the measured change began with reach, click volume, click cost, or post-click conversion performance. State when a required field is unavailable.
Investigate conversion efficiency
Prompt:
For the campaigns with the largest CPA or ROAS decline, show cost, primary conversions, conversion value, CPA, and ROAS for both periods. Include the selected conversion-field definition and note possible conversion-lag effects.
Move into diagnostic detail only when needed
After the campaign view identifies a specific problem, request the most relevant next breakdown. Depending on the campaign and available fields, this may include ad group, search term, device, location, day of week, or landing page.
This keeps the main dashboard readable while allowing deeper analysis inside the same conversation.
How to reuse the dashboard with fresh data
Save the dashboard as a reporting specification rather than treating the last response as a current report. Retain:
the customer ID;
selected conversion field;
metric definitions;
reporting grain;
comparison logic;
output order; and
validation rules.
For a recurring weekly report, you can replace fixed dates with this logic:
Prompt:
Use the last seven complete days through yesterday as the current period and the immediately preceding seven complete days as the comparison period. Return the exact dates used.
The connector should retrieve the data again for each reporting cycle, and the new dashboard should state its retrieval time. Reusing an old conversation or prompt does not make the figures current unless the tool is called again.
If Commerce365 offers saved report layouts, scheduling, agent runs, or PDF exports on the relevant plan, those features can extend the workflow. Confirm their current availability in the live product before promising an automatically refreshed or distributed dashboard.
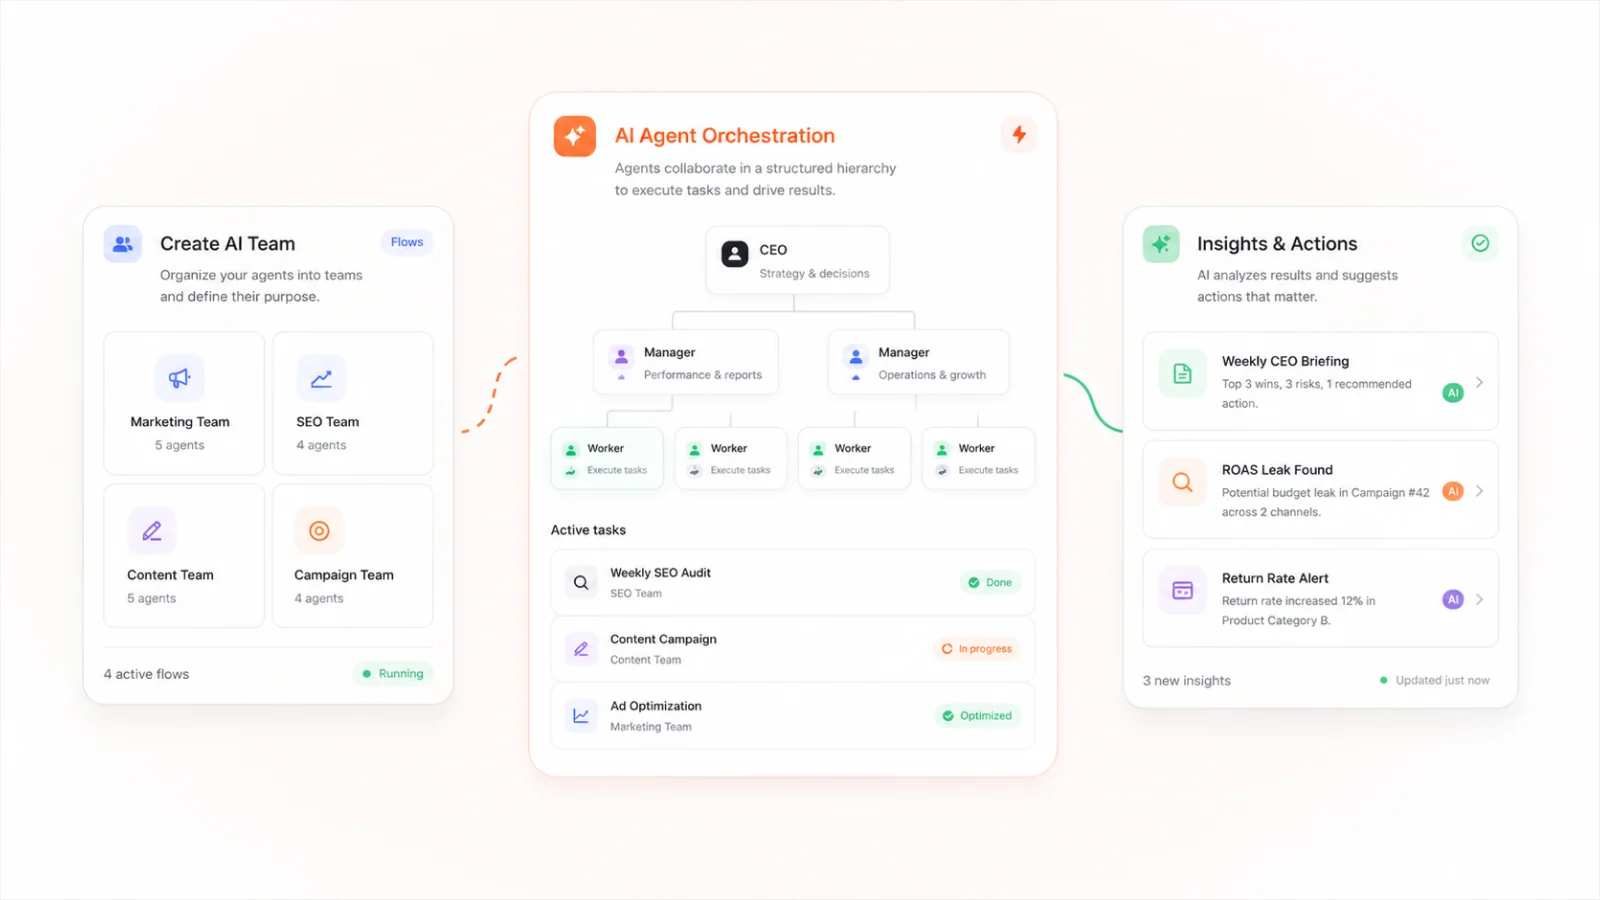
Commerce365 presents agent-based workflows alongside its connected data sources. Source: Commerce365 via Shopify App Store.
Why might the Claude dashboard differ from Google Ads?
The wrong customer account was queried
Check the numerical customer ID, especially when the authorised identity can reach several accounts through a manager account.
The dates or timezone differ
Compare the exact start and end dates. Confirm that Claude used the Google Ads account timezone rather than the user's local timezone.
The dashboard used “All conversions”
Google defines All conversions as the main conversions plus conversion actions excluded from the primary “Conversions” column. A dashboard based on “All conversions” will not match a Google Ads table configured with “Conversions”.
Conversion data is still arriving
Recent conversion figures may increase after the first report. Check the account's conversion lag before concluding that a recent period underperformed.
The dashboard mixed reporting grains or filters
Account totals may differ from a visible campaign table if the table excludes campaigns, statuses, or rows. Confirm that totals and detail use compatible filters and grains.
A calculation used the wrong source field
Check the cost, conversion count, and conversion value behind every ratio. Also check currency, zero-value handling, rounding, and the denominator used for percentage changes.
Claude did not call the connector
A well-written response can still be generic. Confirm that Google Ads is connected inside Commerce365 and that Commerce365 is connected and enabled for the Claude conversation. These are separate checks. Then rerun the small connection-check prompt before requesting the full dashboard.
Inspect the tool result for the intended customer, dates, and values. If authentication fails, follow Anthropic's connector troubleshooting instructions to disconnect and reconnect the Claude connector, then verify access again.
Build the dashboard around a verified reporting question
Start with the decision the dashboard needs to support. Confirm the account, dates, currency, timezone, and conversion field before requesting a polished layout. Build the account overview first, reconcile it with Google Ads, and then add campaign detail, trends, and diagnostic breakdowns.
Commerce365 supplies the account connection and retrieval tools used throughout this workflow. Connect Google Ads inside Commerce365, connect Commerce365 to Claude, and verify a small data request before building the full view. For the broader platform setup, use the Google Ads and Meta Ads connection guide.
Related articles


