How to Measure AI Search Visibility: Citations, Referrals, and the Metrics That Exist Today

By Robin Laseur

Two dashboards, same brand, same month. One reports AI visibility at 34 and climbing. The other reports a share of voice near 9 percent and flat. Both vendors are competent and neither is lying. To measure AI search visibility is to sample: you either probe the models with prompts and count what comes back, read your own logs and analytics for arrivals, or accept a modeled estimate of exposure. Four metric families exist today, presence, citation, referral, and accuracy, and none of them is a ranking.
The reason those two dashboards disagree is not tooling immaturity. It is that they are measuring different things and calling both of them visibility. This article explains the mechanism behind each number, what each one can carry in a report, and the sampling discipline that turns any of them into something a decision can rest on.
What AI search visibility measurement can and cannot tell you today
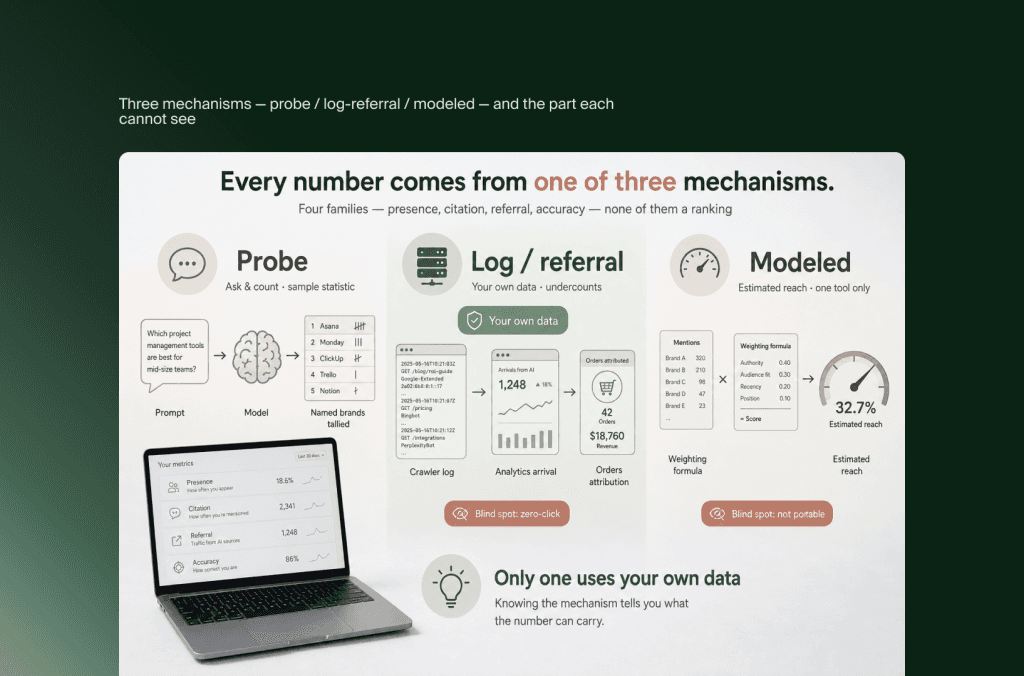
Measurement of AI search visibility answers three questions: does a model name your brand for the questions your buyers ask, does it treat your pages as a source worth citing, and does any of that produce arrivals on your site. Everything currently on the market is an estimate of one of those three, produced by one of three mechanisms.
The reason classic metrics came up short is well covered elsewhere and takes one paragraph. A generated answer often satisfies the question, so there is no session, no pixel event, and no keyword position to track. Rank tracking assumes a stable ordered list, and generated answers are neither stable nor consistently ordered. Organic traffic can stay flat while presence in answers grows, which is why a traffic-only report reads as stagnation during the exact period the channel is being built.
Here is what each metric actually measures, and the part it cannot see:
Two consequences follow from that table. Only one row uses your own data. And the three probe-based rows all inherit their reliability from a prompt set that someone chose, which is the part of the method almost never shown in a report.
Driver 1: probe-based measurement, or asking the machine and counting
Probe-based measurement works by running a fixed set of prompts against AI platforms on a schedule, then counting how often your brand is named and how often your pages are cited. Presence, citation share, and share of voice all come from this mechanism. The number is a sample statistic, and every property of the sample is inherited by the number.
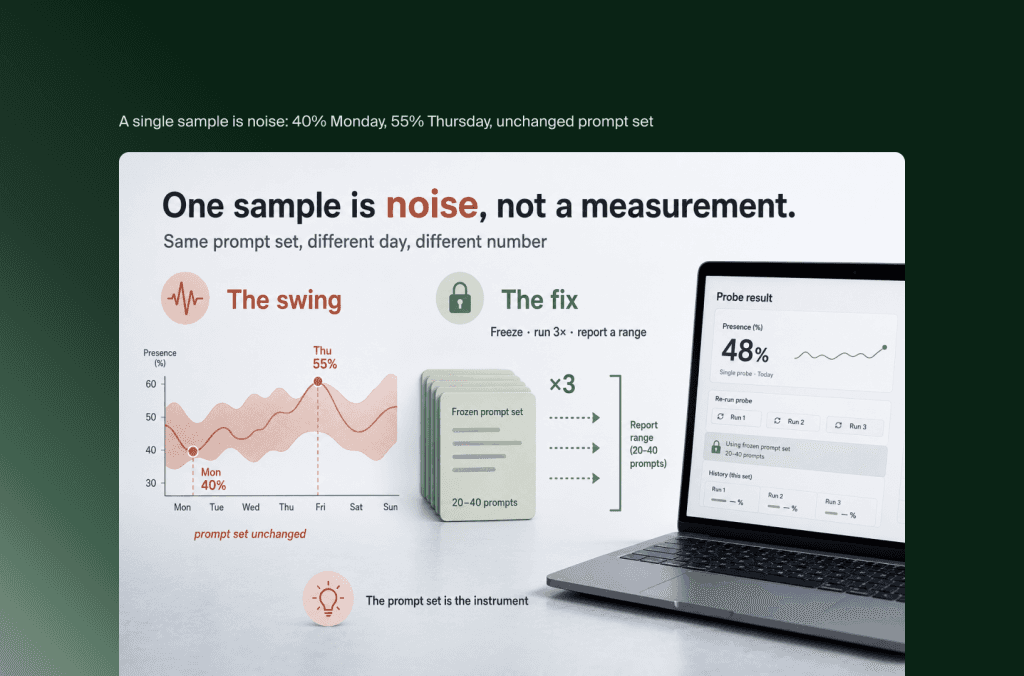
Four variables move the result without anything changing on your site. The prompt set decides everything: forty commercial prompts in your category produce a different picture than forty definitional ones, and a vendor that generates prompts automatically has chosen for you. The platform mix matters, because presence in AI Overviews and presence in ChatGPT are separate outcomes with separate causes. Login state and personalization change answers for real users in ways a clean API probe never sees. Repetition is the one most reports skip: ask the same question three times in one afternoon and the named brands and their order frequently change.
That last property is the reason a single sample is noise rather than a measurement. If your presence reads 40 percent on Monday and 55 percent on Thursday with an unchanged prompt set, you have learned nothing about your content and something useful about the variance of the system.
The intervention point in this driver is ownership of the prompt set. Write it yourself, from real buyer language, and freeze it. A frozen set of twenty to forty prompts that you control is worth more than a generated set of four hundred you cannot inspect, because only the frozen set makes month two comparable with month one. Guides to tracking AI visibility rarely say this out loud, though the mindset shows up in adjacent work: our piece on getting a skincare brand cited by AI treats citation as a reputation measured over time rather than a position to win, which is the same idea arriving from the trust side.
Driver 2: log and referral measurement, or counting what actually arrived
Log and referral measurement reads your own data: server logs for AI crawler user agents, analytics referral patterns for arrivals from chat interfaces, and order-level channel attribution inside your commerce platform. This is the only mechanism in the field that counts real events rather than sampled ones, and it systematically undercounts.
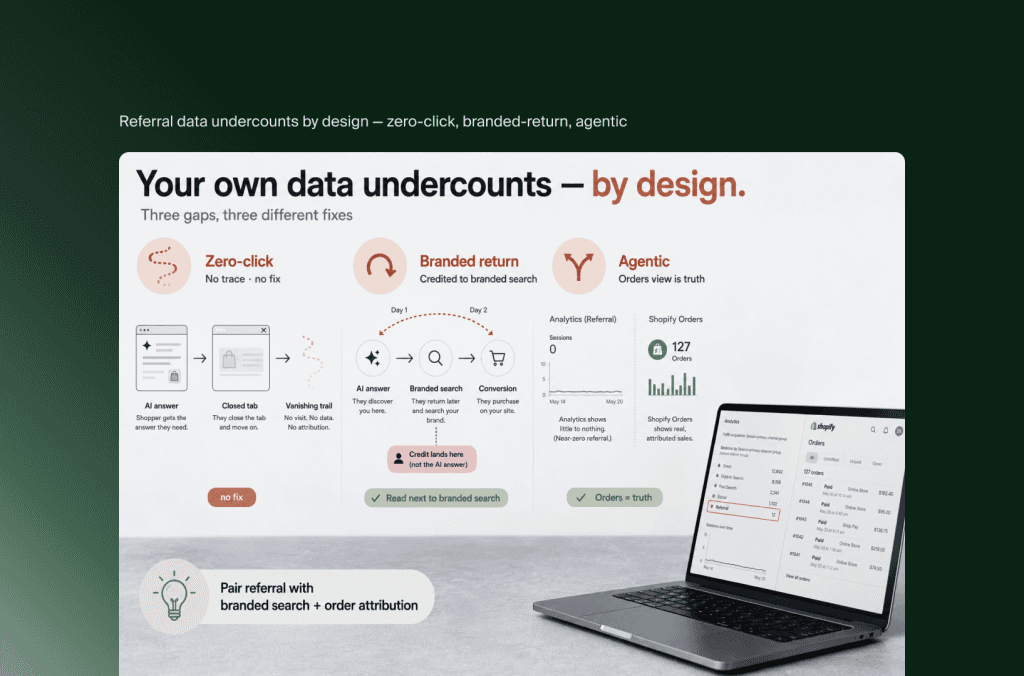
It undercounts for three separate reasons, each with a different fix.
The zero-click gap is structural. A shopper who reads your brand name inside a generated answer and takes no action leaves no trace in your analytics at all. No fix exists for this one, which is why probe-based presence has to sit next to referral data rather than being replaced by it.
The branded-return path is subtler and more expensive to misread. A buyer sees you in an answer, closes the tab, searches your brand name two days later, and converts through organic. Every credit lands on branded search. Read literally, your AI referral line stays near zero while the channel is working, and someone reasonably concludes the work produced nothing. Watching branded search volume alongside AI referral traffic is the practical partial answer, since a rising branded-query trend with flat classic rankings usually points somewhere upstream.
The agentic gap is newer and specific to commerce. Certain Shopify features, custom pixels among them, are not supported on some agentic storefront channels, per Shopify’s own requirements documentation. Orders can therefore land with channel attribution recorded in the Shopify admin while client-side analytics shows nothing. For merchants active on those channels, the Orders view is the system of record and the analytics dashboard is the incomplete copy. Our walkthrough of the Shopify agentic storefront covers where that attribution appears.
The intervention point here is timing. Build the referral segment and start logging crawler hits before you change anything on the site, because this is the one measurement in the article that cannot be reconstructed retroactively.
Driver 3: modeled exposure, or estimating how many people saw it
Modeled metrics convert presence into an estimate of reach. Ahrefs, for example, defines its impressions metric as potential exposure calculated by weighting mentions against Google search volume, and its share of voice as the percentage of brand impressions you hold against competitors. Composite index scores from other vendors work on the same principle: a raw appearance count, weighted by an estimate of how many people would plausibly have asked.
Two things follow. Modeled numbers are the most useful for leadership reporting, because they translate presence into something that behaves like reach. They are also the least portable. The weighting is proprietary, the prompt universe is proprietary, and the resulting score has no meaning outside the tool that produced it. A move from 34 to 41 inside one platform is a real trend. The same 41 next to a competitor’s 62 from a different platform is a category error.
Modeled scores can also move while your site sits untouched, because the underlying prompt volume estimates and index composition get updated. Read them as directional, quarter over quarter, in one tool only.
The bottleneck: variance and non-comparability
The constraint on AI visibility measurement right now is not tool availability. Plenty of tools exist and most of them work. The constraint is that no two of their numbers mean the same thing, and that single samples of a variable system carry no signal. Those two properties together explain nearly every measurement argument happening in reporting meetings this quarter.
Google’s own reporting adds a third complication. AI Overviews and AI Mode sessions are not fully separated from regular organic traffic in Search Console, as Semrush documents in its guidance on AI visibility reporting, so classic organic lines already contain AI-surface activity that cannot be cleanly extracted. Reporting AI visibility metrics separately from organic metrics is currently the honest presentation, rather than attempting a split the data does not support.
Three rules resolve most of it. Pick one probe tool as the system of record and stop comparing its output to any other vendor’s score. Freeze the prompt set and the platform list, and record the date on every snapshot. Repeat the sample enough times per cycle that you can see the spread rather than one draw from it. A presence figure reported as a range across three runs is more defensible than a precise-looking single number, and it survives the first person who reruns your prompt and gets something else.
Pair every visibility number with an outcome number. Presence that climbs for two quarters while leads, branded search, and revenue all sit still is measuring the verbosity of a system rather than your standing in a market. That pairing is also what keeps the metric out of the vanity column when a CFO tests it.
Where measurement effort actually pays this quarter
Six pieces of work produce a baseline worth defending, and none of them requires a new budget line.
Write the prompt set. Twenty to forty prompts in real buyer language, drawn from your search queries, sales calls, and support tickets. Freeze it and version it.
Fix the platform list. Pick the surfaces where your buyers are, typically AI Overviews and AI Mode, ChatGPT, and one of Perplexity, Copilot, or Gemini depending on market. Record the list alongside the prompt set.
Run the sample three times per cycle. Same prompts, same platforms, same week, dated. Record presence, citation, and the sources cited instead of you.
Build the referral segment before changing anything. Isolate arrivals from AI surfaces in analytics, start logging AI crawler user agents, and note the current branded-search baseline next to it.
Audit accuracy once per quarter. Read twenty answers and mark what the model says about your brand that is outdated or incorrect. This is the cheapest measurement in the article and the one that most often produces immediate content work.
Report in two blocks. Presence, citation share, and accuracy as the visibility block, with the sample method stated. Referral, branded search, and orders as the outcome block. Modeled scores as a single directional line, quarterly.
Across Flatline’s AI consultancy engagements the pattern is consistent: teams arrive with a tool subscription and no prompt set, which is the equivalent of a rank tracker with no keyword list. The subscription is the easy part. The prompt set, the cadence, and the dated baseline are the work, and they are what make the third month’s report readable.
Frequently Asked Questions
What is a good AI visibility score?
No portable answer exists, because each vendor calculates its score from a proprietary prompt universe and weighting. A score of 40 in one platform and 40 in another describe different things. Use your own first dated snapshot as the benchmark and measure movement against it, in one tool, with a frozen prompt set.
Can I see AI Overviews performance in Google Search Console?
Not separately. AI Overviews and AI Mode activity is folded into regular organic reporting rather than broken out, so any figure presented as AI Overview traffic from Search Console alone involves an assumption. Report probe-based visibility metrics separately from Search Console organic data instead of attempting a split.
How many prompts do I need to track?
Twenty to forty real buyer prompts, repeated three times per measurement cycle, gives a usable read for a mid-market catalog. Sample size matters less than stability: a small frozen set measured repeatedly produces comparable months, while a large generated set that changes between runs produces numbers that cannot be compared to each other.
Does AI referral traffic show the real impact of AI search? It shows the click-visible portion, which is a minority of it. Buyers who see a brand in an answer and later return through branded search are credited to branded search, and orders placed on some agentic channels are recorded in Shopify while client-side tracking misses them. Read referral traffic next to branded search volume and platform-level order attribution.
Key Takeaways
Three mechanisms produce every number in this field: probing models with prompts, reading your own logs and analytics, and modeling exposure from volume estimates. Knowing which mechanism produced a figure tells you what it can carry in a report.
The prompt set is the measurement instrument. A frozen set of twenty to forty prompts you wrote yourself makes months comparable; a generated set you cannot inspect does not.
Non-comparability is the current bottleneck. Pick one probe tool as the system of record, date every snapshot, and stop comparing scores across vendors.
Referral data undercounts by design, through zero-click answers, branded-search return paths, and agentic channels where client-side tracking is unsupported. Pair it with branded search volume and platform order attribution.
The teams that will have something credible to show by year end are the ones recording a dated baseline this month, with the prompt set written down beside it. The measurement problem in AI search is not that the metrics are missing. It is that most of them are being read without their method attached.
Related articles